Technical Field Note #14 · November 2026
IMU noise and bias of a stereo+IMU egocentric rig, measured from static recordings
Field Note #14 · IMU noise, bias and spectrum from static segments (ODL-EGO S1 capture rig, R8 stereo+IMU)
Visual-inertial pipelines need the IMU noise parameters of the actual unit. The calibration file shipped with our rig carries generic priors and says so. We measured the unit from 5 static segments (22 minutes in total, longest 519 s) found inside the 2026-10-26 calibration recordings, without new capture. Gyro white noise is 0.00014–0.00018 rad/s/√Hz per axis and accelerometer white noise 0.0009–0.0014 m/s²/√Hz, roughly 12× and 22× below the priors. Two practical traps: the gyro z axis has strong high-frequency noise, so a per-sample standard deviation overstates its noise density 2.4×; and the gyro reads -0.32 °/s on z at rest, about 19° of heading per minute if not removed. Random walk could not be identified from records this short.
Why this matters
Noise parameters decide how much a fusion filter trusts the IMU
VIO and SLAM back-ends weigh the IMU against the cameras using four numbers per sensor: white-noise density and bias random walk for the gyroscope and the accelerometer. Priors that are too large make the IMU nearly useless; priors that are too small make the filter over-trust it and drift.
Our rig's calibration file states its IMU values are priors to be replaced by a dedicated static recording. We had not made one. This note shows that the calibration session already contained enough still time to measure the white-noise part reliably, and where it does not suffice.
Data
5 static segments from four existing recordings
Source: the IMU streams of four recordings made on 2026-10-26 during the ChArUco calibration sessions (Field Notes #11 and #12), when the rig sat still on a desk while targets were moved. No new capture was made.
Static detection: 1 s windows with every gyro axis standard deviation below 0.06 rad/s, runs of at least 60 s, 2 s trimmed at each edge. This gave 5 segments from 59 to 519 s (1348 s in total). The gyro and accelerometer each run at 501.5 Hz; the gyro output step is 0.000533 rad/s (0.0305 °/s), consistent with a ±1000 °/s range.
Method: overlapping Allan deviation per axis; white noise N fitted on the −½ slope between τ = 0.05 and 1 s; bias instability taken as the Allan minimum (reported as the raw minimum, without the 0.664 factor); bias as the segment mean.
White noise
About 12× below the priors, on every axis and segment
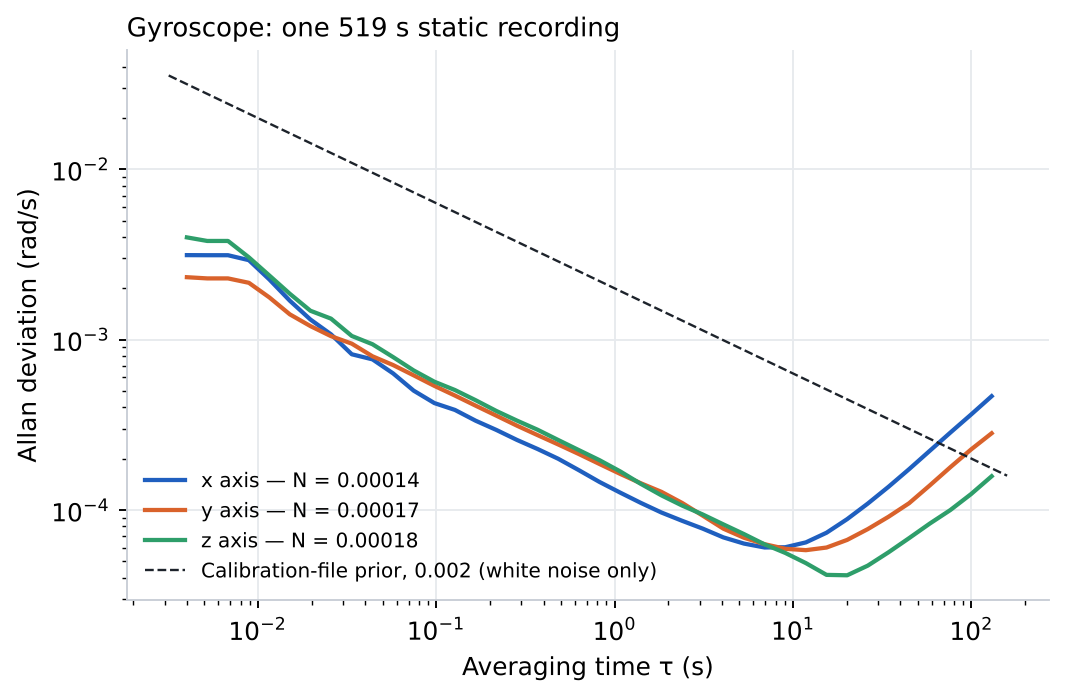
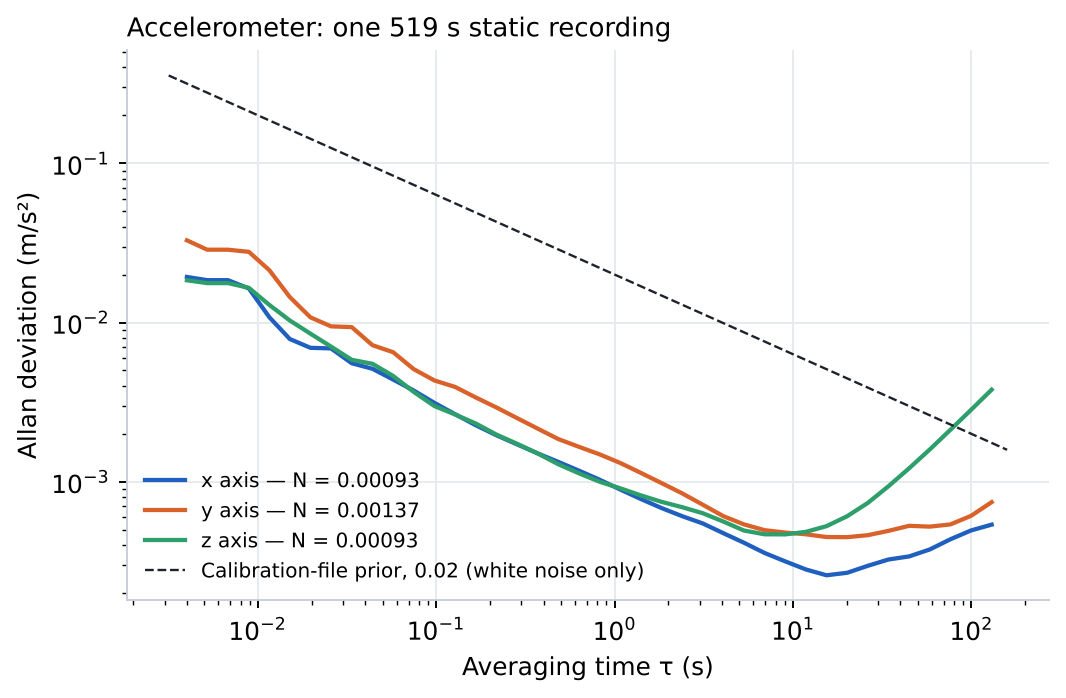
On the longest segment (519 s) the gyro white noise is 0.00014, 0.00017 and 0.00018 rad/s/√Hz on x, y and z, and the accelerometer 0.00093, 0.00137 and 0.00093 m/s²/√Hz. Across all 5 segments the gyro values stay within 0.00014–0.00024 and the accelerometer within 0.00085–0.00137.
The priors in the calibration file (0.002 and 0.02) are about 12× and 22× larger. At long averaging times the picture changes: the gyro Allan deviation turns upward after 7–20 s, and at τ ≈ 100 s it is 0.000124–0.000363 rad/s, comparable to the 0.000200 rad/s the priors imply there. So the priors are far too pessimistic for short-term noise but not obviously wrong for slow drift.
| Quantity | x | y | z | Calibration-file prior |
|---|---|---|---|---|
| Gyro white noise N, Allan fit (rad/s/√Hz) | 0.00014 | 0.00017 | 0.00018 | 0.002 |
| Gyro noise from per-sample std (rad/s/√Hz) | 0.00024 | 0.00014 | 0.00043 | — |
| Gyro bias instability, Allan minimum (rad/s) | 0.000060 | 0.000058 | 0.000041 | — |
| at averaging time (s) | 7 | 12 | 20 | — |
| Gyro Allan deviation at τ ≈ 100 s (rad/s) | 0.000363 | 0.000226 | 0.000124 | 0.000200 (white + random walk) |
| Gyro bias at rest (°/s) | +0.13 | -0.07 | -0.32 | — |
| Accel white noise N, Allan fit (m/s²/√Hz) | 0.00093 | 0.00137 | 0.00093 | 0.02 |
| Accel bias instability, Allan minimum (m/s²) | 0.00026 | 0.00045 | 0.00047 | — |
Trap 1
The gyro z axis is not white: do not estimate it from the sample standard deviation
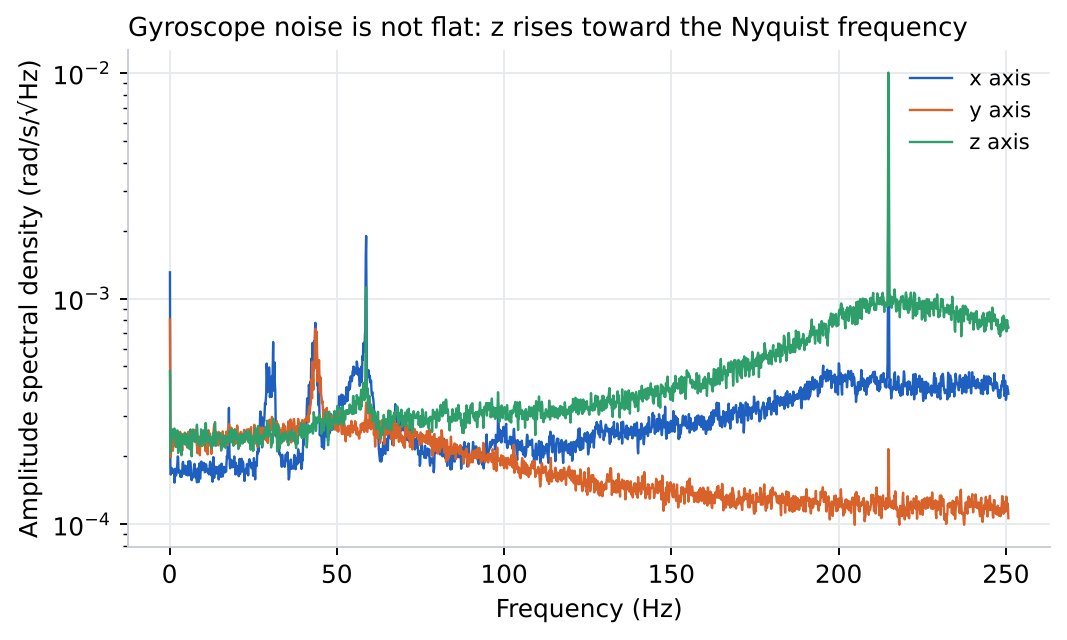
A quick estimate divides the per-sample standard deviation by √(sample rate). For x and y this lands near the Allan value. For z it gives 0.00043 rad/s/√Hz, 2.4× the Allan fit, because the z noise rises toward the Nyquist frequency (lag-1 autocorrelation -0.67). That high-frequency part averages out within a few milliseconds and does not drive drift.
The spectrum also shows narrow peaks near 30, 44, 59 and 215 Hz. Their source (a desk-borne vibration, a fan, or electronics) was not identified; they do not change the Allan fit but are worth checking on a mounted rig.
Trap 2
A 0.3 °/s gyro bias at rest
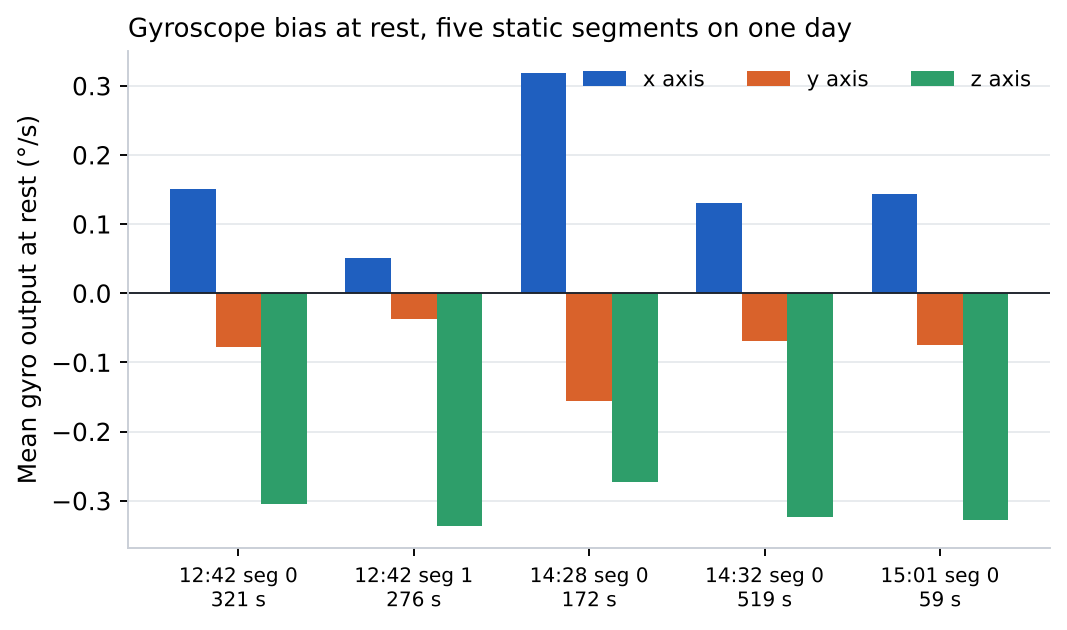
At rest the gyro reads +0.05 to +0.32 °/s on x, -0.16 to -0.04 °/s on y and -0.34 to -0.27 °/s on z across the 5 segments. Left uncorrected, the z value alone rotates the heading by about 19° per minute.
The z bias is stable across the day; x varies more. A fusion filter estimates the bias online, but initialising it from the first still second of each recording, rather than from zero, shortens convergence.
- Keep the rig still for 2–3 s at the start of every recording.
- Initialise gyro bias from that still window.
- Do not compare gyro biases across recordings to judge sensor health without accounting for warm-up.
| Static segment | Duration (s) | Gyro bias x / y / z (°/s) | Gyro N, median of axes | Accel norm (m/s²) |
|---|---|---|---|---|
| 12:42 #0 | 321 | +0.15 / -0.08 / -0.31 | 0.00017 | 9.802 |
| 12:42 #1 | 276 | +0.05 / -0.04 / -0.34 | 0.00018 | 9.802 |
| 14:28 #0 | 172 | +0.32 / -0.16 / -0.27 | 0.00019 | 9.803 |
| 14:32 #0 | 519 | +0.13 / -0.07 / -0.32 | 0.00017 | 9.782 |
| 15:01 #0 | 59 | +0.14 / -0.07 / -0.33 | 0.00017 | 9.796 |
Interpretation
What we will put in the calibration file
Verified: the white-noise densities above, the gyro bias at rest, and the gyro output step. Recommendation for our deliveries: state measured white-noise densities with the usual inflation for unmodelled effects rather than the current 10–20× generic priors, and keep the random-walk terms as priors until a dedicated recording of several hours exists.
Not identified: bias random walk (records ≤519 s cannot separate random walk from warm-up drift), temperature dependence (the raw temperature field's scale is unconfirmed), accelerometer biases (each segment had a different tilt, so bias and gravity direction are not separable; the measured gravity norm was 9.782–9.803 m/s²), and behaviour on a head mount.
SCOPE AND LIMITS
Limitations
What this note does not show, stated up front.
- Single R8 stereo+IMU unit, desk-mounted, one indoor office, one day (2026-10-26); results are not a population estimate for other units.
- All measurements are automated. No independent human re-analysis was performed: AI/algorithm-only preliminary analysis.
- Static segments are 59–519 s long; Allan values beyond about one quarter of the segment length are not reported and random walk is not identified.
- Static detection uses a gyro threshold; two segments show slow accelerometer changes (likely the desk being touched) and were kept but not used for the headline numbers.
- IMU part number and configured ranges are as reported by the supplier and the data; the accelerometer range setting was not confirmed. The temperature field was not used.
- Raw IMU streams are released only after approval; derived tables are included.
FAQ
Questions data buyers ask
Q01What is the gyroscope white-noise density of this rig?
Q02Can you measure IMU noise without a dedicated static recording?
Q03Why does the per-sample standard deviation give a different noise density?
Q04How large is the gyro bias at rest?
Q05Should the calibration-file priors be replaced?
OPEN DATA AND CODE
Reproduce and inspect the evidence
Every number in this note can be checked: derived tables, analysis code, figures and a runnable notebook are public.
 GitHubAnalysis code and reproduction steps
origin-data-lab/imu-noise-bias-static-characterization-stereo-imu-rigView repository  Hugging FaceDataset card, tables and figures
origin-data-lab/imu-noise-bias-static-characterization-stereo-imu-rigOpen dataset  Data explorer and runnable notebook
origindatalab/odl-static-imu-allanExplore on Kaggle Licence: CC BY 4.0 (data and figures) · MIT (code)
Origin Data Lab (2026). Technical Field Note #14: IMU noise and bias of a stereo+IMU egocentric rig, measured from static recordings. https://origindatalab.io/technical-field-notes/imu-noise-bias-static-characterization-stereo-imu-rig.html
Need real-world data measured to this standard?
Origin Data Lab plans and runs egocentric, stereo+IMU and field video capture with documented QA, for physical AI and robotics teams.