Technical Field Note #13 · November 2026
The wrong calibration file: how we caught a stereo calibration made for a different sensor mode
Field Note #13 · Diagnosing a stereo calibration made for the wrong sensor mode (ODL-EGO S1 capture rig)
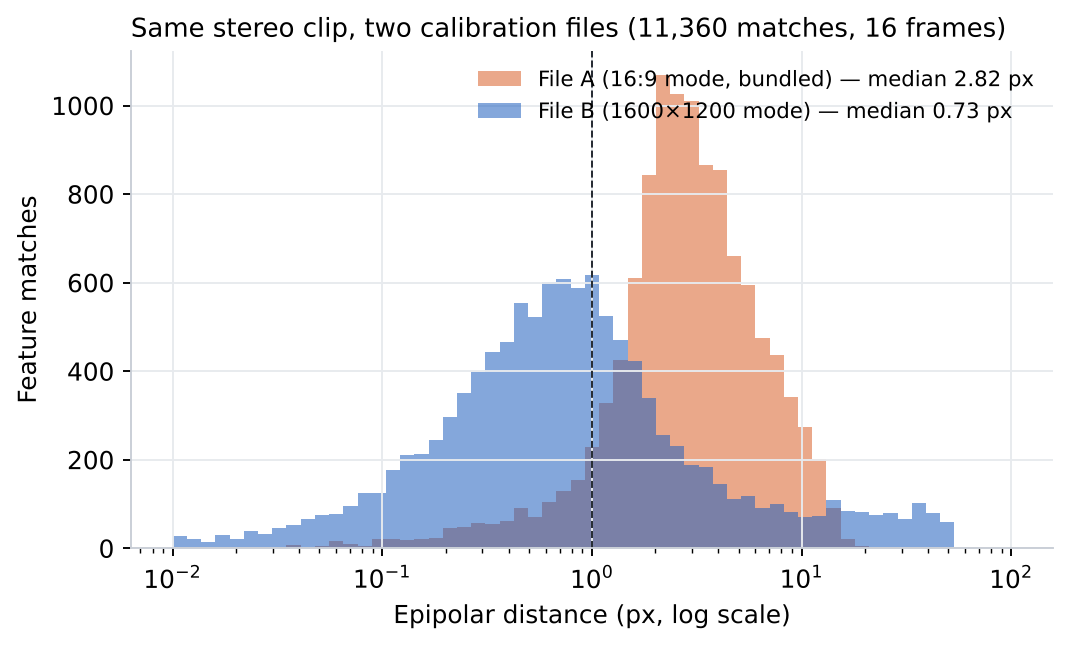
An evaluation package we shipped earlier included a manufacturer stereo calibration file that, on inspection, belonged to a 16:9 recording mode, while the footage was recorded in the rig's 4:3 1600×1200 mode. A data reviewer flagged it, correctly. This note shows how the mismatch shows up and how it was confirmed. Seven file-level checks expose it without any data. On 112,538 ChArUco corners the wrong file gave a 2.40 px median epipolar distance against 0.33 px for the rig's 1600×1200-mode file. On the same real bimanual clip the reviewer saw, the error dropped from 2.82 px to 0.73 px, and the share of matches under 1 px rose from 10% to 61%. Every delivery now names the calibration file, its recording mode and a validation run on that delivery's own frames.
Why this matters
A calibration file can be correct and still wrong for your footage
Stereo cameras often support several recording modes (resolution, aspect ratio, crop, binning). A calibration is valid only for the mode it was computed in. A file from another mode loads without errors, rectifies without errors and produces depth without errors. It is simply wrong, by several pixels of vertical misalignment and by several percent of metric scale.
We shipped exactly this mistake in an earlier evaluation package. This note documents it as a reusable check: what to look at in the file, what the residuals look like, and how to confirm the right file on the footage itself.
- Rule we now follow: a calibration file is delivered only together with its recording mode and a residual check on the same delivery's frames.
Setup
Two manufacturer files, one rig, one recording mode
Rig: R8 stereo+IMU, recording mode 1600×1200 per eye at 30 fps, fisheye lenses. Two calibration files were supplied with the hardware.
File A: a stereo JSON (pinhole model with 5 distortion terms, 60.2 mm baseline, no resolution field). This was the file bundled in the earlier package. File B: a Kalibr camchain (equidistant fisheye model, 800×600, 65.08 mm baseline).
Test data: (1) ChArUco board recordings of 2026-10-26 in the 1600×1200 mode, every second sampled frame, 112,538 matched corners; (2) the 120 s real bimanual work clip from the earlier package (2026-10-21), 16 frames spread across the clip, 11,360 SIFT matches after a loose outlier filter that uses no calibration.
Check 1
Seven checks that need no data
Before computing anything, the file itself gives the mismatch away. File A states no resolution, its principal point is 217 px from the centre of a 1600×1200 image and doubles to a ~2004×1044 (16:9) image, and its focal length is 34% longer than File B's. File B states 800×600, exactly half of the recording mode, and its principal point lands 15 px from the centre after scaling.
| Check (no data needed) | File A | File B | What it tells you |
|---|---|---|---|
| Resolution stated in the file | not stated | 800×600 (exactly ½ of 1600×1200) | A file without its resolution cannot be trusted for a mode |
| Principal point (px) | (1002, 522) | (807, 613) after ×2 | Should sit near (800, 600) on a 1600×1200 sensor |
| Distance of principal point from 1600×1200 centre | 217 px | 15 px | >100 px is a red flag |
| Image size implied by principal point × 2 | ~2004 x 1044 | ~1615 x 1226 | A implies a ~16:9 image; the footage is 4:3 |
| Focal length (px) | 646 | 482 | A 34% longer focal length means a different crop/scale |
| Lens model | pinhole + 5 terms | equidistant fisheye | A wide-angle lens needs a fisheye model at the edges |
| Baseline (mm) | 60.2 | 65.08 | Depth scales with baseline: an 8% difference becomes an 8% depth error |
Check 2
Residuals on targets with known geometry
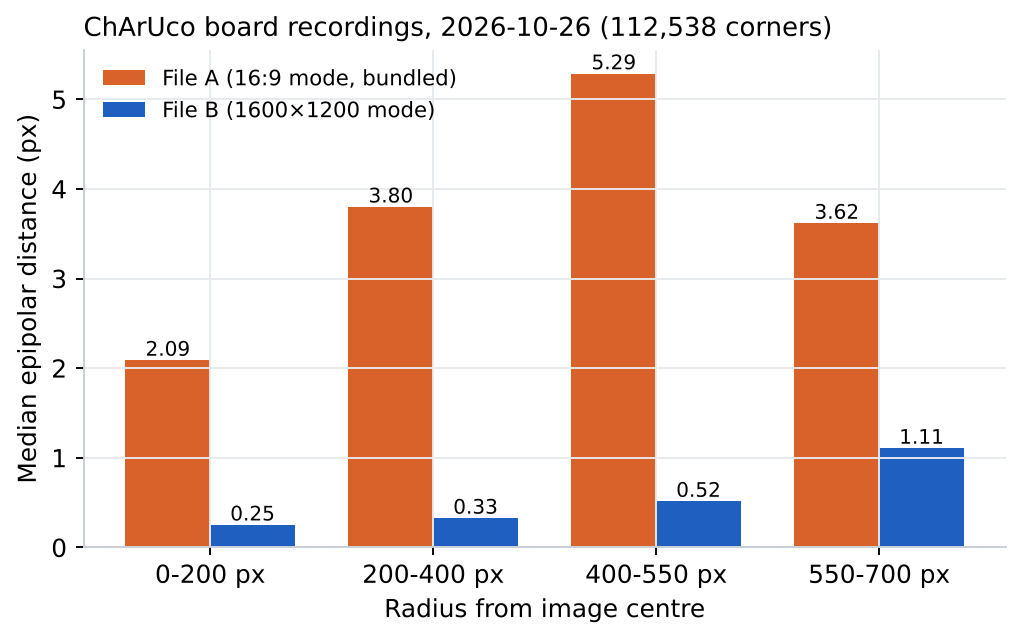
On 112,538 board corners, File A gave a median epipolar distance of 2.40 px (90th percentile 7.89 px) and File B 0.33 px (1.04 px). With intrinsics held fixed, File A also failed to reproduce the board itself: 1.63 px median reprojection against 0.28 px.
The tell-tale pattern is that File A's error is large already at the image centre (2.1 px) and peaks at 400–550 px from it, while File B rises smoothly from 0.25 px toward the fisheye periphery.
| Test | Data | File A (16:9 mode) | File B (1600×1200 mode) |
|---|---|---|---|
| Epipolar distance, median | ChArUco recordings, 112,538 corners | 2.40 px | 0.33 px |
| Epipolar distance, 90th percentile | same | 7.89 px | 1.04 px |
| Left reprojection, median (intrinsics fixed) | same | 1.63 px | 0.28 px |
| Epipolar distance, median | Real bimanual clip, 11,360 feature matches | 2.82 px | 0.73 px |
| Matches under 1 px | same | 10% | 61% |
Check 3
Confirming on the real footage, without any target
A buyer usually has no target in the footage. Feature matches between left and right frames are enough: with the right calibration, matched points must lie on the epipolar line. On the real work clip, File A placed the median match 2.82 px off its line, File B 0.73 px; 61% of matches were within 1 px with File B against 10% with File A.
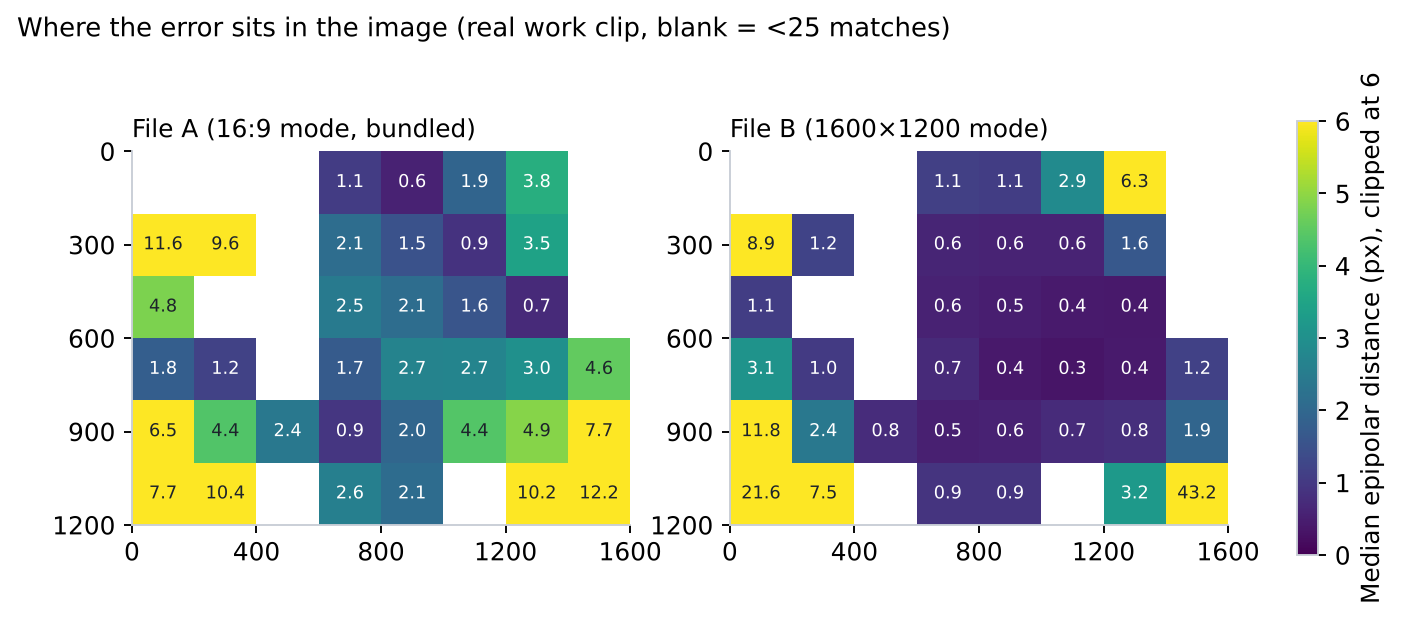
File B is not perfect at the extreme corners of the fisheye image, where both files show large values (Field Note #11 measured the same periphery limit on targets). The comparison that matters is the central field, where the work happens.
Interpretation
What changed in our process
Verified: File B is consistent with the 1600×1200 recording mode on targets and on real footage; File A is not. Interpretation: File A was produced in a 16:9 mode of the same camera family and should never have been bundled. Its 60.2 mm baseline would also have scaled all depths by about 8% if used.
Process changes: each delivery names the calibration file, the recording mode it belongs to and the device it was made on; includes the seven file checks; and includes an epipolar check on its own frames, so a mismatch cannot pass silently again.
- Check the resolution field and principal point before using any calibration file.
- Run a feature-match epipolar check on a few frames of every delivery; a median above ~1 px in the image centre is a stop signal for this rig.
- Never infer the recording mode from the file name or the supplier's description alone.
SCOPE AND LIMITS
Limitations
What this note does not show, stated up front.
- Single R8 stereo+IMU unit, single indoor office, single day (2026-10-26); results are not a population estimate for other units.
- All measurements are automated (OpenCV detection, triangulation, fitting). No independent human re-measurement was performed: AI/algorithm-only preliminary analysis.
- The factory calibration file is third-party material; it is used for evaluation but is not redistributed. Raw videos are not published (they contain people and a private office).
- Feature matches on real footage include some false matches; medians and shares under 1 px are reported, not means.
- The real-clip test uses 16 frames of one 120 s clip; the board test uses one day of recordings.
- The origin of File A (which mode of which unit) is inferred from its parameters; the manufacturer has not confirmed it.
FAQ
Questions data buyers ask
Q01How do I know whether a stereo calibration matches my recording mode?
Q02What happened in this case?
Q03Can you check calibration without a calibration target in the footage?
Q04Does a wrong calibration file also affect depth scale?
Q05Is the corrected calibration perfect?
OPEN DATA AND CODE
Reproduce and inspect the evidence
Every number in this note can be checked: derived tables, analysis code, figures and a runnable notebook are public.
 GitHubAnalysis code and reproduction steps
origin-data-lab/stereo-calibration-sensor-mode-mismatch-diagnosisView repository  Hugging FaceDataset card, tables and figures
origin-data-lab/stereo-calibration-sensor-mode-mismatch-diagnosisOpen dataset  Data explorer and runnable notebook
origindatalab/odl-stereo-calibration-mismatchExplore on Kaggle Licence: CC BY 4.0 (data and figures) · MIT (code)
Origin Data Lab (2026). Technical Field Note #13: Diagnosing a stereo calibration made for the wrong sensor mode. https://origindatalab.io/technical-field-notes/stereo-calibration-sensor-mode-mismatch-diagnosis.html
Need real-world data measured to this standard?
Origin Data Lab plans and runs egocentric, stereo+IMU and field video capture with documented QA, for physical AI and robotics teams.