Technical Field Note #22 · November 2026
Checking stereo sync from the outside: a flashing monitor puts left and right within 0.15 ms
Field Note #22 · External optical check of left/right synchronisation on a head-mounted stereo+IMU rig (ODL-EGO S1), follow-up to Field Note #18
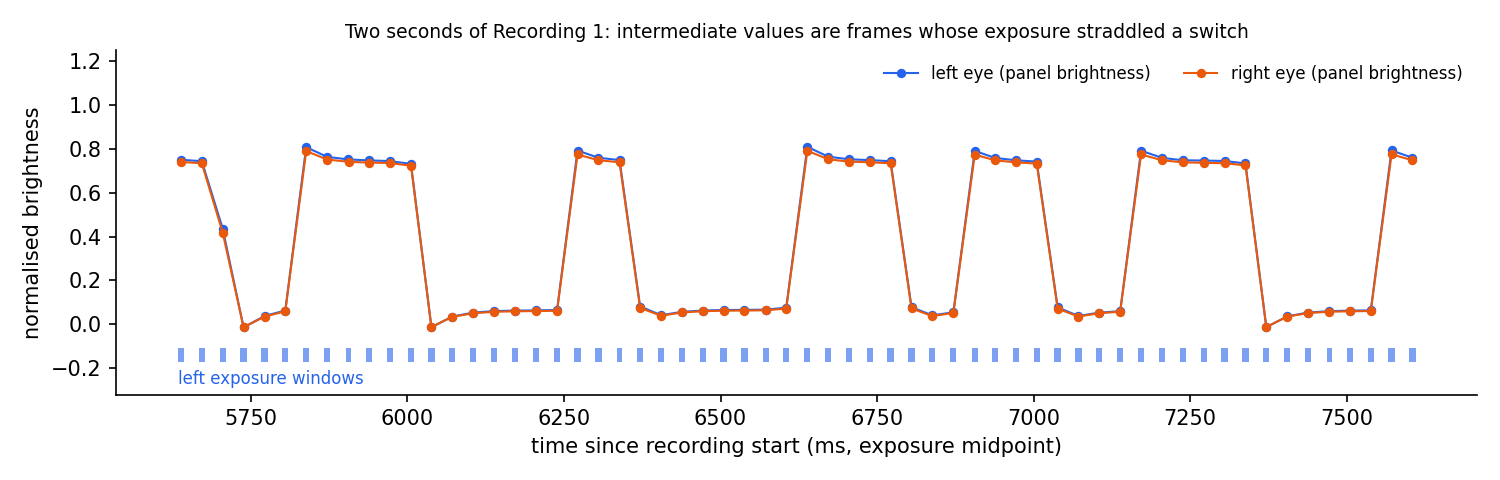
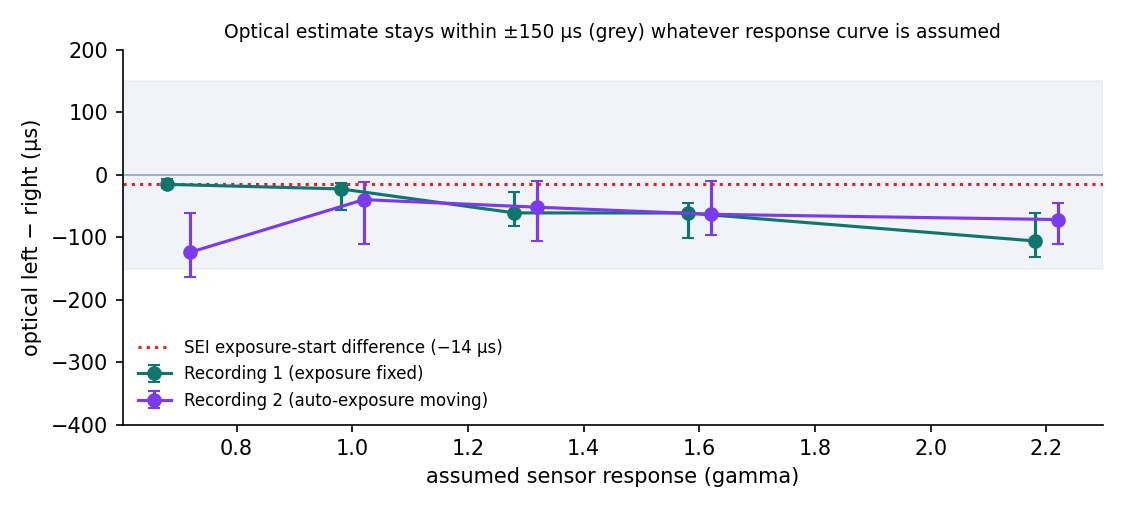
In Field Note #18 we measured our stereo rig's left/right synchronisation at 15 µs, but only from the exposure timestamps the rig writes about itself. Here we checked it from the outside. A PC monitor flashed a panel black and white at random 70–250 ms intervals while both eyes filmed it, in two 2-minute recordings (362 flashes each). Frames whose exposure straddled a switch record a partial brightness; the share of the exposure that saw white, combined with each eye's own exposure start and duration, places the switch in time. Each eye timed the same 357 and 316 switches independently. Averaging rising and falling edges (which cancels brightness-gain differences between the eyes), left − right was −23 µs (95% CI −56 to −14) and −40 µs (−110 to −12); under every sensor-response curve we tried it stayed within ±0.15 ms. That holds in the second recording even though auto-exposure was active and the left exposure was 0.5 ms shorter than the right. The optical method cannot resolve 14 µs, but it independently confirms there is no hidden offset larger than about 0.15 ms: under 0.5% of a frame, about 0.25 px of image motion during a fast 200°/s head turn.
Why this matters
A rig should not be the only witness to its own timing
Stereo depth, stereo SLAM and hand-pose triangulation assume both images in a pair were exposed at the same instant. In Field Note #18 we found that our rig's left and right exposures start a median 15 µs apart, but that number came from the exposure-start timestamps the rig writes into its own video stream. If the firmware stamped both eyes from the same clock while the sensors actually fired at different times, the metadata would still look perfect.
This note closes that gap with an external, optical reference: something both cameras can see change at a single physical moment, timed independently from each eye's images.
Setup
A flashing monitor panel and two 2-minute recordings
Rig: R8 stereo+IMU (ODL-EGO S1), the same unit as in Field Notes #15–#21, 1600×1200 per eye at 30 fps, set on a desk facing a PC monitor. The monitor showed a page that switched a panel between black and white at random 70–250 ms intervals. No display refresh or flash schedule was logged; the method does not need one.
Recording 1 (2026-11-08 13:32, camera slightly below the monitor): exposure steady at 10.04 ms in both eyes. Recording 2 (13:36, camera at mid-monitor height): auto-exposure active, left 6.9–11.3 ms, and the left exposure a median 0.51 ms shorter than the right. Each recording contains about 120 s of flashing (362 flashes).
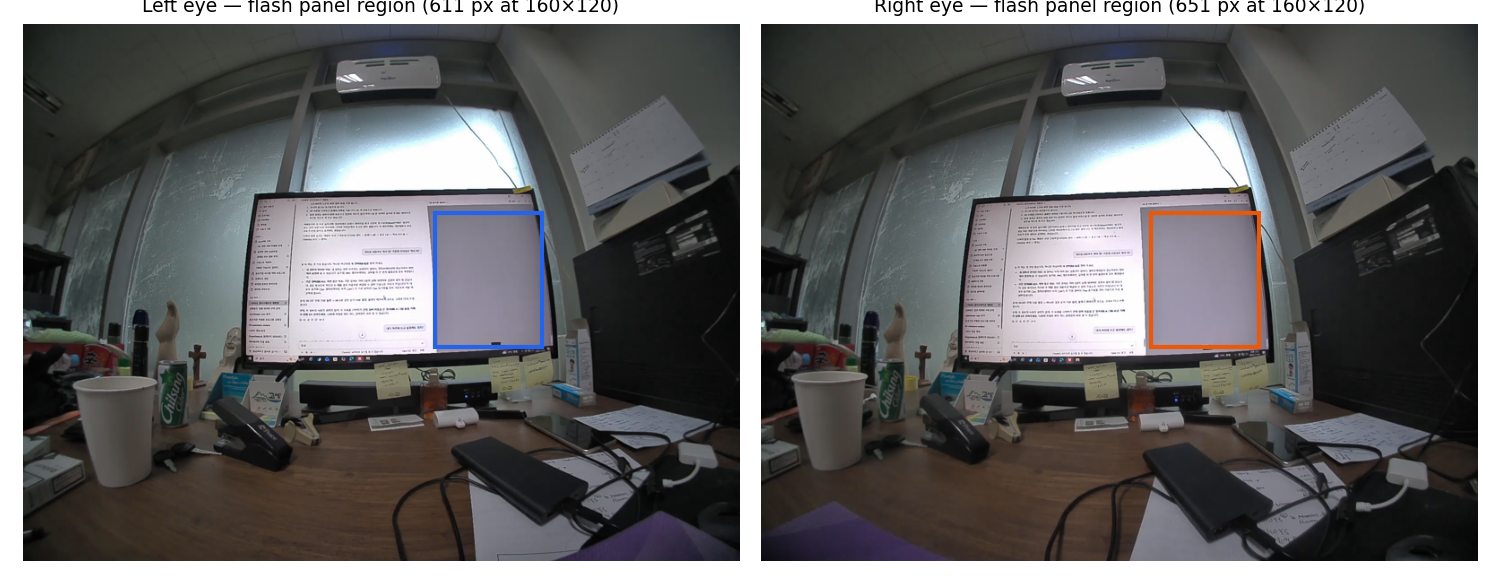
Per frame and eye we used the exposure start and exposure duration (µs) from the stream metadata and the mean brightness of the panel region, found automatically as the pixels that toggled most often (611 and 651 px at 160×120 in recording 1).
Method
Timing a switch from a partly exposed frame
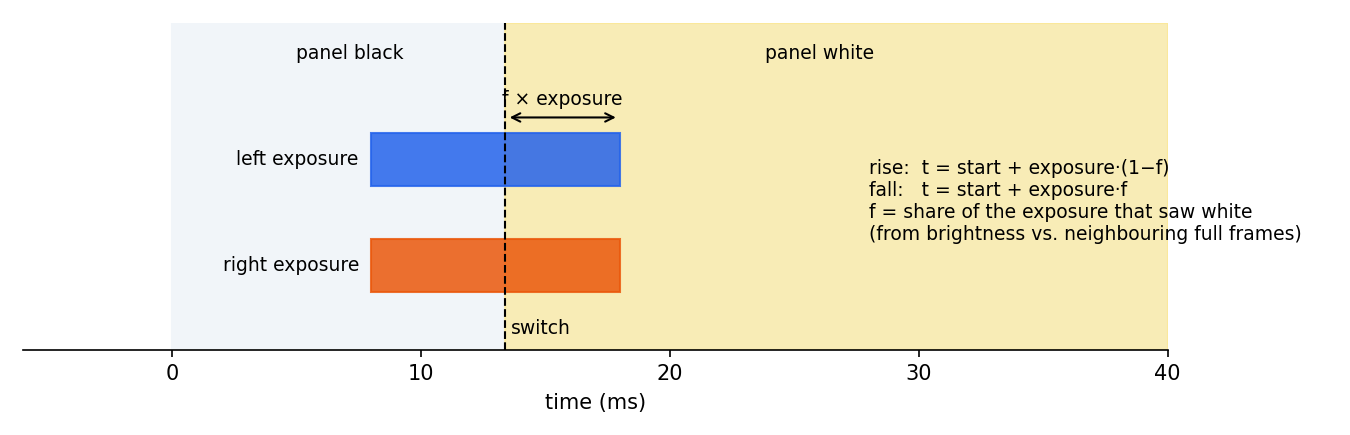
Each exposure lasts about 10 ms of the 33.3 ms frame period. If the panel switches while a frame is being exposed, that frame records an intermediate brightness. The share f of the exposure that saw white, taken against the full-black and full-white frames on either side (rescaled to the same exposure time), places the switch: for a rise, t = start + exposure × (1 − f); for a fall, t = start + exposure × f.
Each eye does this with its own images and its own timestamps, so for every switch both eyes see we get two independent times. Their difference is the synchronisation error the metadata would have to hide. We used only switches with full frames on both sides and 0.05 < f < 0.95 in both eyes.
Converting brightness to light needs the sensor's response curve, which we do not know. A gain or response mismatch between the eyes shifts rise and fall estimates in opposite directions, so we report the mean of the rise median and the fall median, and repeat everything for response exponents γ = 0.7, 1.0, 1.3, 1.6 and 2.2.
Finding 1
Left and right time the same switches within tens of microseconds
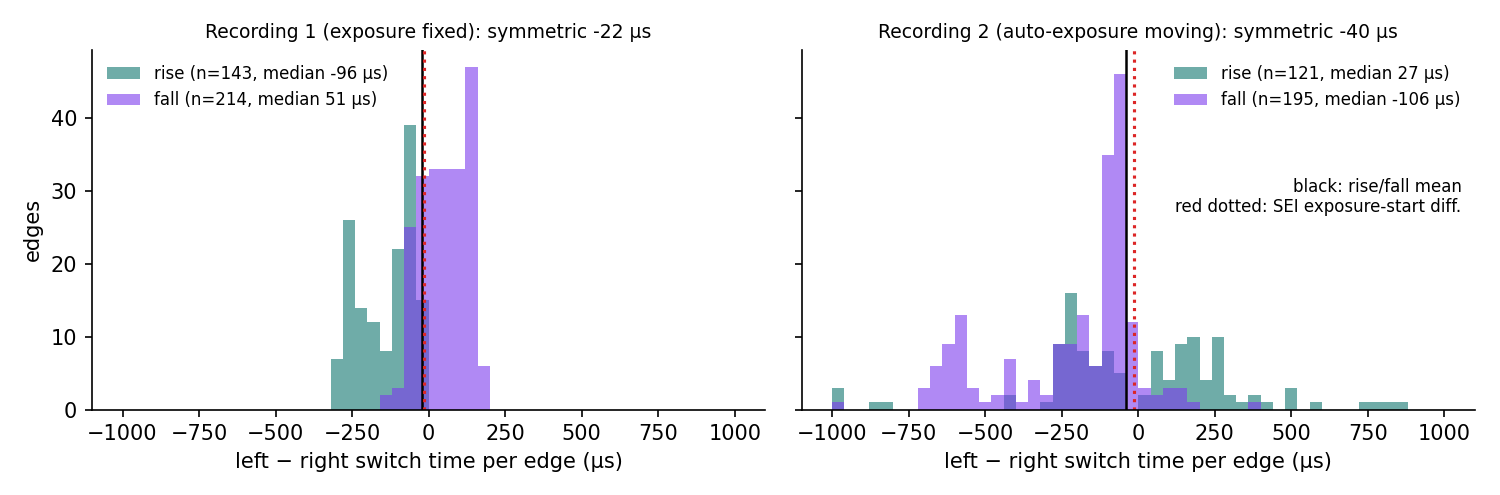
Recording 1: 357 switches timed in both eyes; left − right was −96 µs for rises and +51 µs for falls, −23 µs on average (95% bootstrap CI −56 to −14 µs). Recording 2: 316 switches; +27 µs for rises, −106 µs for falls, −40 µs on average (−110 to −12 µs). The per-switch spread (median absolute deviation 81 and 127 µs) is the method's own noise, set by brightness noise inside a 10 ms window.
The binary black/white state agreed in every frame. 18 of 7,194 frames during flashing fell on different sides of the threshold, but all of them were mid-switch frames at 47–53% brightness in both eyes.
| Recording | Camera position | Exposure (L / R, median) | Flashes | Edges used (rise / fall) | Rise median | Fall median | Optical L − R (γ = 1, 95% CI) | Range over γ 0.7–2.2 | SEI exposure-start L − R (median / max) |
|---|---|---|---|---|---|---|---|---|---|
| 1 | slightly below the monitor | 10.04 / 10.05 ms | 362 | 357 (143 / 214) | −96 µs | +51 µs | −23 µs (−56 to −14) | −15 to −106 µs | −14 / 49 µs |
| 2 | mid-monitor height | 8.99 / 9.42 ms | 362 | 316 (121 / 195) | +27 µs | −106 µs | −40 µs (−110 to −12) | −40 to −124 µs | −14 / 60 µs |
Finding 2
The result does not depend on the assumed response curve, or on equal exposures
Across γ 0.7–2.2 the average stayed between −15 and −106 µs in recording 1 and between −40 and −124 µs in recording 2: always within ±0.15 ms, always the same sign as the metadata (left slightly earlier).
Recording 2 is the harder case: auto-exposure was moving and the two eyes did not choose the same exposure (left a median 0.51 ms shorter). Individual rise estimates then tracked the exposure difference (correlation 0.78), because the display does not switch instantly and a shorter window integrates the transition differently. Averaged, the result still matched recording 1.
Side observation
Pair frames by exposure start, not by presentation timestamp
In recording 1 both eyes carried identical presentation timestamps (PTS) in every pair. In recording 2 they matched in only 0.4% of pairs and differed by up to 1.0 ms, while the exposure starts of the same pairs were still within 60 µs. Pairing by PTS would still have found the right frames here, but PTS is evidently not a hardware timestamp. We pair by nearest exposure start (within 2 ms), which agrees with the order-based rule of Field Note #18.
How to check your own rig
Fifteen minutes, one monitor, no extra hardware
Anyone with a stereo rig that records per-frame exposure times can repeat this.
- Show a panel that switches black/white at random 70–250 ms intervals (random, so no switch pattern locks to the frame rate); film it for 2 minutes with both eyes.
- Find the panel automatically as the most frequently toggling pixels; take its mean brightness per frame.
- Pair frames by exposure start; time every partly exposed switch in each eye with its own exposure start and duration.
- Average rise and fall medians; repeat for several response curves. A rig with a real offset shows it in all of them.
What this means
Synchronisation is now verified twice, by two independent routes
Verified: on this rig, an external optical reference agrees with the internal metadata. There is no hidden left/right offset larger than about 0.15 ms, which is under 0.5% of a frame; during a fast 200°/s head turn that is 0.03°, about 0.25 px at this camera's 482 px focal length.
Process: the flash recording becomes a standard acceptance test for every new rig before field use, alongside the per-frame metadata checks of Field Note #18. The scripts and per-switch tables are published with this note.
- Optical check per rig before deployment: pass if all γ within ±0.5 ms.
- Metadata check on every delivery: every pair within 1 ms by exposure start.
- Report per-eye exposure differences; auto-exposure can diverge between eyes.
SCOPE AND LIMITS
Limitations
What this note does not show, stated up front.
- One rig, two 2-minute recordings in one office on one day, camera static; not a population estimate.
- The method assumes the display switches the whole panel at the same moment for both eyes; display scan-out and pixel response are common to both cameras but limit precision to roughly 0.1 ms per switch.
- The sensor response curve is unknown; results are reported for γ 0.7–2.2 rather than for a calibrated curve.
- The flash schedule was not logged; switch times are known only from the images, so the absolute timing of each eye is not tested, only their difference.
- All checks are automated: AI-assisted preliminary analysis; no human re-verification or third-party review.
FAQ
Questions data buyers ask
Q01How can I verify stereo camera synchronization without special hardware?
Q02How well synchronized is the ODL-EGO S1 stereo rig?
Q03Why average rising and falling edges?
Q04Can this method measure 15 µs?
Q05Do the left and right cameras use the same exposure?
OPEN DATA AND CODE
Reproduce and inspect the evidence
Every number in this note can be checked: derived tables, analysis code, figures and a runnable notebook are public.
 GitHubAnalysis code and reproduction steps
origin-data-lab/stereo-sync-external-flash-verificationView repository  Hugging FaceDataset card, tables and figures
origin-data-lab/stereo-sync-external-flash-verificationOpen dataset  Data explorer and runnable notebook
origindatalab/odl-stereo-sync-external-flashExplore on Kaggle Licence: CC BY 4.0 (data and figures) · MIT (code)
Origin Data Lab (2026). Technical Field Note #22: Checking stereo sync from the outside. https://origindatalab.io/technical-field-notes/stereo-sync-external-flash-verification.html
CONTINUE READING
Related field notes
Want this measured on your data?
Origin Data Lab plans and runs egocentric, stereo+IMU and field video capture with documented QA, for physical AI and robotics teams.