Technical Field Note #11 · October 2026
Is the factory calibration good enough? Independent validation of a fisheye stereo camera over 237,000 corner observations
Field Note #11 · Independent validation of a fisheye stereo factory calibration (ODL-EGO S1 capture rig)
Many stereo devices ship with a factory calibration that the data producer never checks. We tested the one supplied with our R8 unit on 237,393 ChArUco corner observations from 11 recordings covering 107–1512 px horizontally and 154–990 px vertically of the 1600×1200 image. With intrinsics held fixed, the median reprojection residual was 0.28 px everywhere the targets reached. The stereo epipolar residual was 0.25 px near the centre and rose to 1.13 px at 550–700 px radius. An independent fisheye recalibration from our own 381 views matched the factory intrinsics within 0.4% in focal length but had worse stereo consistency (0.56 vs 0.34 px), so we keep the factory calibration and use ours as a check. Once scaled to ruler-measured target size, both routes point to a baseline about 0.4% longer than the factory value.
Why this matters
A calibration file is a claim, not a measurement
Every metric quantity derived from stereo video — depth, 3D hand position, object size — passes through the calibration. A factory file reports its own fit quality on its own calibration images; it does not tell you how it performs on your recordings, at your distances, across your whole image.
We treat the factory calibration as a hypothesis and test it with data that played no part in producing it.
Data
What the calibration was tested on
237,393 corner observations from 11 recordings made on 2026-10-26 with one R8 unit: hand-held target sessions with the rig fixed, wall-target distance and edge sessions with the rig hand-held, and one fast-rotation session. Two printed ChArUco boards were used (9×6 with 29.17 mm squares and 5×3 with 53.4 mm squares). Frames in which a target was shown on a curved monitor were excluded.
The factory file (Kalibr format, equidistant fisheye model, 800×600) was scaled to the native 1600×1200 resolution (focal length and principal point ×2, plus a 0.5 px centre shift).
Method
Two residuals, measured where the data actually is
Reprojection residual (left camera): for every frame we fixed the factory intrinsics, solved only the target pose, re-projected the board and measured the pixel distance to each detected corner. This tests the lens model.
Epipolar residual: for every matched left/right corner we measured the pixel distance of the right corner from the epipolar line predicted by the factory stereo extrinsics. This tests the stereo geometry independently of the target size and pose.
Both residuals were summarised on a 200 px grid and by radius from the principal point. For comparison we ran an independent fisheye recalibration (OpenCV) on 381 of our own views and evaluated it identically, including a split-half repeat.
Result 1
The lens model holds wherever we had targets
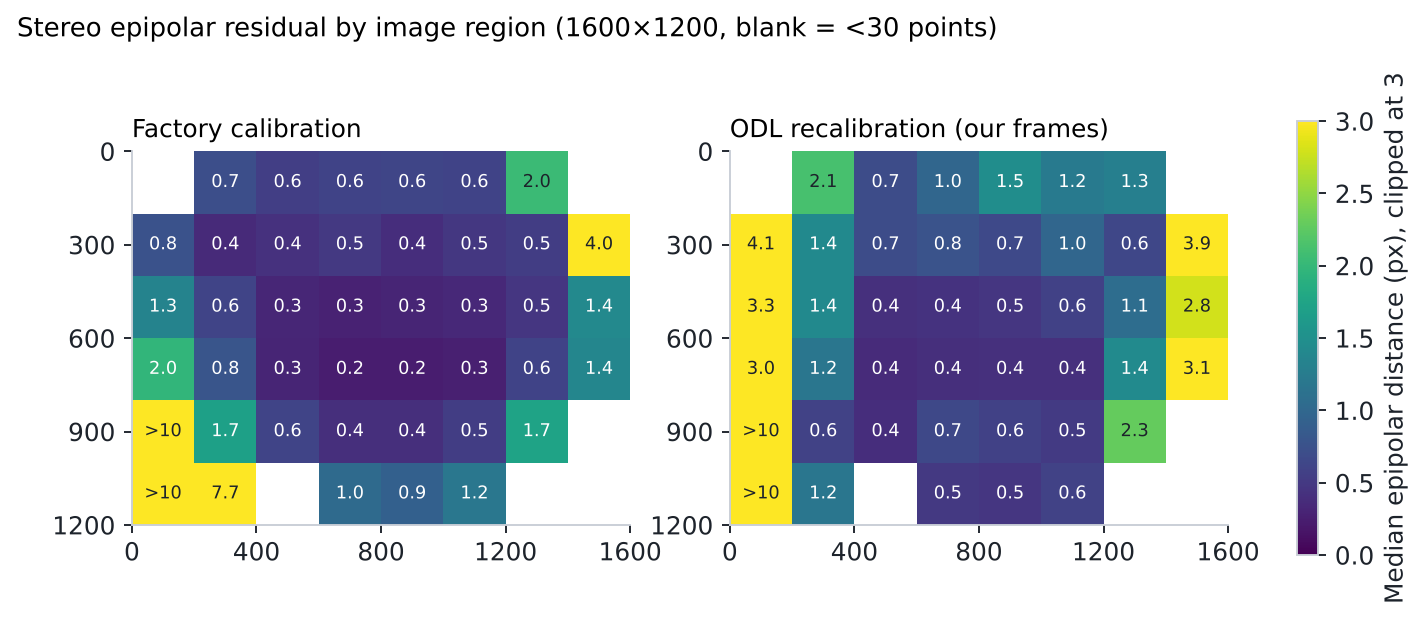
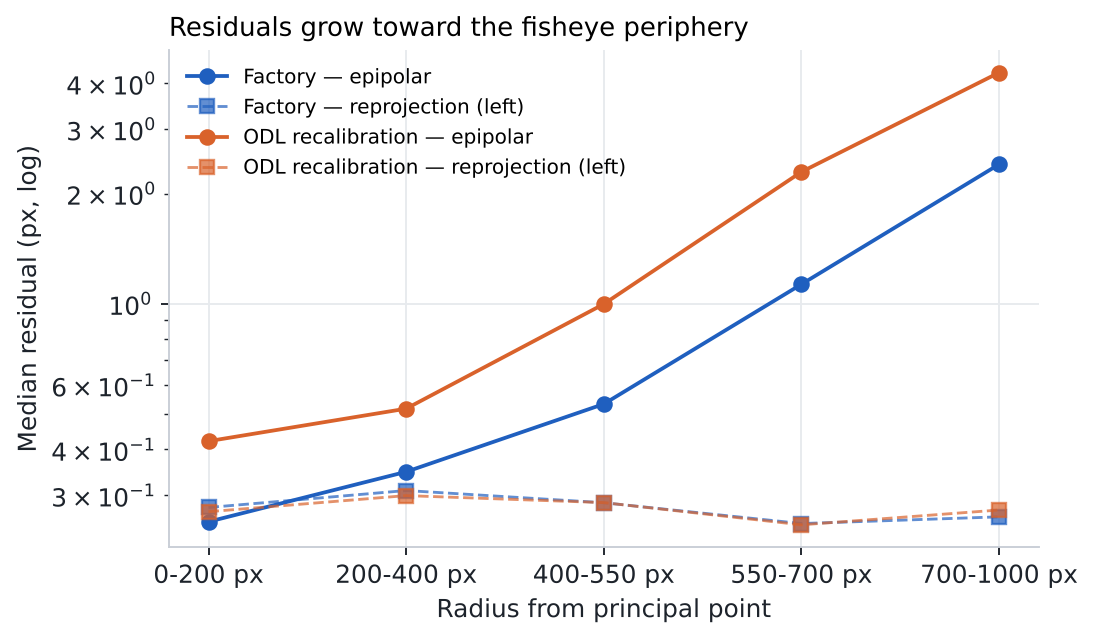
The median reprojection residual was 0.28 px overall and stayed between 0.25 and 0.31 px across all radius bands that had data. The large p90 in the outermost band comes from corners in the lower-left corner cells, outside the area the factory model reliably covers.
Result 2
Stereo consistency degrades toward the fisheye periphery
The epipolar residual grew from 0.25 px within 200 px of the centre to 0.35, 0.53 and 1.13 px in the following bands, and exceeded 10 px in the lower-left corner cells. Per recording, the centre residual ranged from 0.20 to 0.75 px.
Because stereo depth comes from horizontal disparity, a vertical misalignment of about 1 px at the periphery does not translate one-to-one into depth error, but it is a sign that the stereo model is extrapolating there. Field Note #09 found the metric scale reliable at the centre and several percent off at the left edge.
| Radius from principal point | Points | Factory epipolar median (px) | Factory epipolar p90 (px) | ODL recal. epipolar median (px) | Factory reprojection median (px) |
|---|---|---|---|---|---|
| 0-200 px | 119,784 | 0.25 | 0.69 | 0.42 | 0.28 |
| 200-400 px | 69,272 | 0.35 | 0.92 | 0.52 | 0.31 |
| 400-550 px | 25,236 | 0.53 | 1.22 | 1.00 | 0.29 |
| 550-700 px | 19,716 | 1.13 | 2.09 | 2.29 | 0.25 |
| 700-1000 px | 3,385 | 2.40 | 32.82 | 4.28 | 0.26 |
Result 3
Our recalibration matches the lens, not the stereo geometry
The independent recalibration reached the same reprojection quality (0.28 px) and focal length within 0.36% of the factory value (split halves agree within 0.14 px), but its stereo epipolar residual was worse at every radius (0.56 vs 0.34 px overall). Our hand-held views are less suited to estimating the inter-camera rotation than a dedicated factory rig.
Both routes agree on scale: fitted with nominal square sizes and then rescaled by the ruler-measured print scale (97.2%), our recalibration gives a 65.36 mm baseline (halves 65.14 and 65.58 mm), 0.43% longer than the factory 65.08 mm. Field Note #09 found factory-calibrated depth 0.5% short against the same rulers. Two independent routes point the same way, but the split-half spread (±0.34%) is of similar size, so we report the correction as an estimate.
| Model | Views | Left fx (px) | Left cx, cy (px) | Right fx (px) | Baseline (mm, ruler-scaled) | Stereo rotation (deg, x/y/z) |
|---|---|---|---|---|---|---|
| Factory | — | 482.35 | 807.4, 613.1 | 481.92 | 65.08 | +0.20 / -0.26 / +0.005 |
| ODL recal. all | 381 | 480.62 | 807.9, 609.8 | 480.63 | 65.36 | +0.48 / -0.14 / +0.012 |
| ODL recal. half1 | 191 | 480.54 | 808.1, 609.6 | 480.37 | 65.14 | +0.47 / -0.09 / +0.008 |
| ODL recal. half2 | 190 | 480.68 | 807.7, 610.0 | 480.88 | 65.58 | +0.49 / -0.20 / +0.016 |
Interpretation
Decision and what it means for data users
Decision: ODL-EGO S1 deliveries use the manufacturer calibration unchanged, together with this validation. Verified: reprojection ≈0.3 px and centre epipolar ≈0.25–0.35 px on our recordings. Estimated: a ≈0.4–0.5% scale correction.
Interpretation: the useful metric area of this fisheye stereo pair is the central part of the image (roughly within 550 px of the principal point). Toward the corners, stereo should be treated as approximate until a calibration with dense corner coverage is available.
- Report per-recording centre epipolar residual as a QC field.
- Mark image regions beyond ~550 px radius as lower-confidence for stereo 3D.
- Re-run this validation per unit and after any mechanical shock.
Limitations
- Single R8 stereo+IMU unit, single indoor office, single day (2026-10-26); results are not a population estimate for other units.
- All measurements are automated (OpenCV detection, triangulation, fitting). No independent human re-measurement was performed: AI/algorithm-only preliminary analysis.
- The factory calibration file is third-party material; it is used for evaluation but is not redistributed. Raw videos are not published (they contain people and a private office).
- Coverage reached about 107–1512 px horizontally and 154–990 px vertically; image corners and the bottom edge are poorly sampled.
- Most views were hand-held, with motion blur possible; frames were filtered for stillness but not for blur.
- Our recalibration used nominal square sizes for both printed boards (both printed at ~97.2%); intrinsics are unaffected, the baseline was rescaled afterwards.
- The factory file is used for evaluation only and is not redistributed; derived numbers are quoted pending supplier approval.
Frequently asked questions
Is the R8 factory stereo calibration accurate?
On 237,393 independent corner observations it gave 0.28 px median reprojection residual and 0.34 px median epipolar residual; the epipolar residual rises to about 1.1 px at 550–700 px from the image centre.
Did ODL recalibrate the camera?
We produced an independent recalibration as a check. It matched the lens model but had worse stereo consistency, so deliveries keep the factory calibration.
Which part of the image is reliable for stereo 3D?
The central region, roughly within 550 px of the principal point on the 1600×1200 image. Corners, especially lower-left, are extrapolated.
What is an epipolar residual?
The pixel distance between a point in the right image and the line on which the calibration predicts it must lie, given its position in the left image. It tests stereo geometry without needing the target size.
Is the factory baseline correct?
Ruler-scaled measurements suggest a baseline about 0.4–0.5% longer than the factory 65.08 mm; the uncertainty is similar in size, so this is an estimate.
RESEARCH RESOURCES
Explore the Technical Resources
Access the code, datasets and evaluation materials.
Want this measured on your data?
Request a sample from our stereo+IMU or phone capture, or ask us to run the same checks on your rig.