Technical Field Note #09 · October 2026
How accurate is stereo depth at hand-work distance? A ruler-referenced check from 25 to 90 cm
Field Note #09 · Stereo depth-scale accuracy across a 25–90 cm working distance (ODL-EGO S1 capture rig)
We triangulated 4,429 stereo frames of two printed ChArUco targets with the rig's factory calibration and compared every reconstructed square with the size measured by steel rule. With the target near the image centre and facing the camera, stereo distances were 0.5% too short (median of 2,492 frames; A4 target -0.50%, far target -0.54%), consistently from 0.25 to 0.85 m. Near the left image edge with ~45° tilt the error became +4.0% to +4.8%, while the right edge stayed within +0.4%. A tape-measure series (30–90 cm) agreed in slope but carried a constant 2–5 cm offset that we attribute to the tape reference point. Everything is an automated, single-unit, single-day measurement.
Why this matters
The question a robot-learning data buyer actually asks
Hand-object interaction in egocentric data happens between roughly 25 and 90 cm from the head-mounted camera. If the stereo depth of that range is biased, every 3D hand trajectory, grasp distance and object size derived from the data inherits the bias.
This note answers a narrow, testable question for one capture configuration (ODL-EGO S1, built on an R8 OEM fisheye stereo+IMU camera): how far off is stereo depth at hand-work distances, and where in the image does it get worse?
- Answer in one line: about 0.5% short near the image centre across 25–85 cm, and up to ~5% long near the left image edge when the surface is strongly tilted.
Setup
Rig, targets and ground truth
Camera: R8 stereo+IMU unit, 1600×1200 per eye at 30 fps, fisheye lenses, factory baseline 65.08 mm (from the manufacturer calibration file supplied with the unit). Depth is computed with that factory calibration, unchanged.
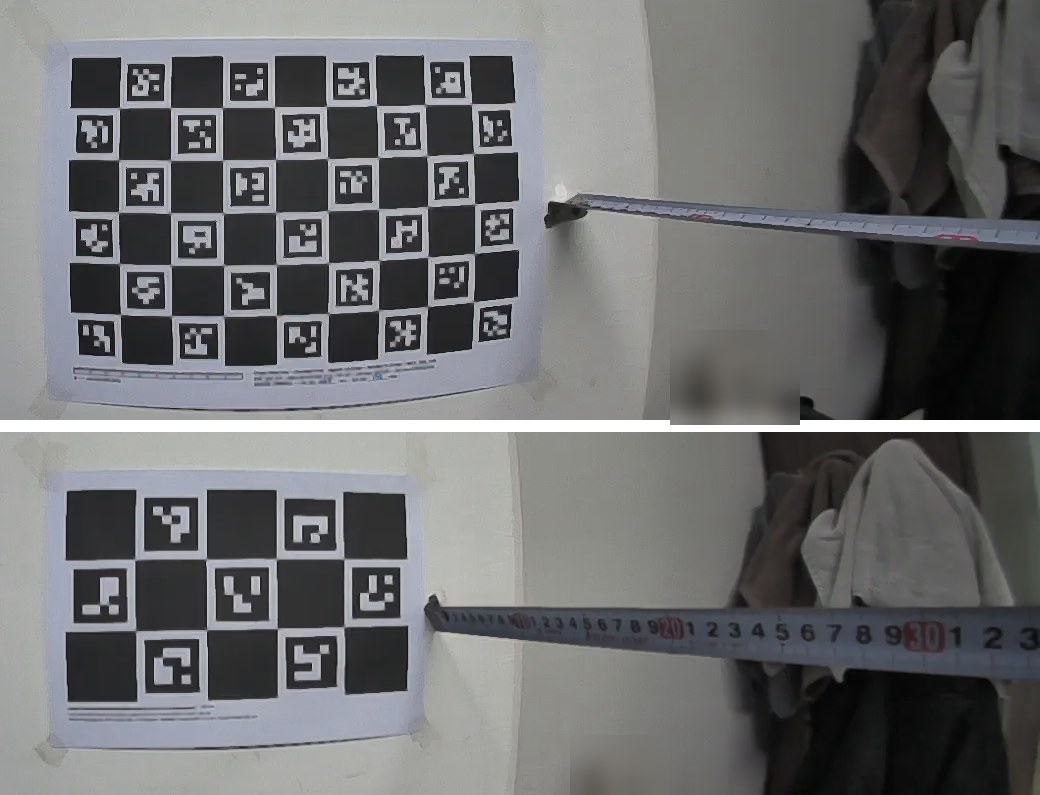
Targets: two ChArUco boards printed on A4 matte paper and taped flat to a painted wall — a 9×6 board with nominal 30 mm squares and a 5×3 far-range board with nominal 55 mm squares. Both printed about 2.8% smaller than nominal, so we did not trust the nominal size.
Ground truth: the full span of each board was measured with a steel rule (A4: 262.5 × 175.0 mm → 29.17 mm squares; far: 267 × 160 mm → 53.40 × 53.33 mm squares). The rig was hand-held and moved to tape-measured positions (zero at the wall) of 30, 40, 50, 60, 70, 80 and 90 cm, then turned so the target sat at the left and right image edges at about 50 and 80 cm.
Method
Ruler-referenced scale error instead of tape distance
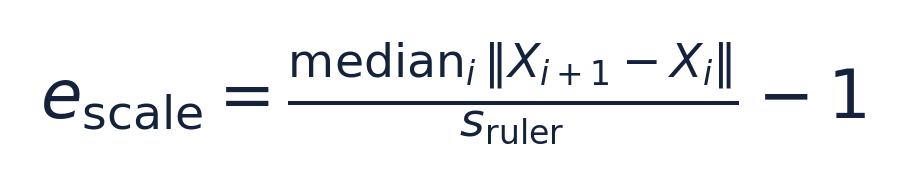
For every stereo frame we detected ChArUco corners in both eyes (OpenCV 4.10), undistorted them with the factory equidistant-fisheye model, triangulated them with the factory stereo extrinsics, and measured the 3D distance between horizontally and vertically adjacent corners. The median neighbour distance per frame, divided by the ruler square size, gives the frame's scale error. Because stereo depth and lateral size share the same scale factor, this error applies directly to depth.
Why not just compare with the tape? The tape reading depends on where its zero and read-off points sit relative to the lens centre, which a hand-held rig cannot fix to the millimetre. A printed square is rigid and was measured with a steel rule, so it is a better reference. The tape series is still reported as a linearity check.
Frames were grouped by distance (0.1 m bins). The "image centre" subset requires the board centre within 300 px of the principal point and a tilt below 15°. Edge subsets require the board centre more than 450 px left or right of the principal point. We report medians, inter-quartile ranges and a 500-sample bootstrap 95% interval of each median.
Result 1
Near the image centre: a steady -0.5% bias
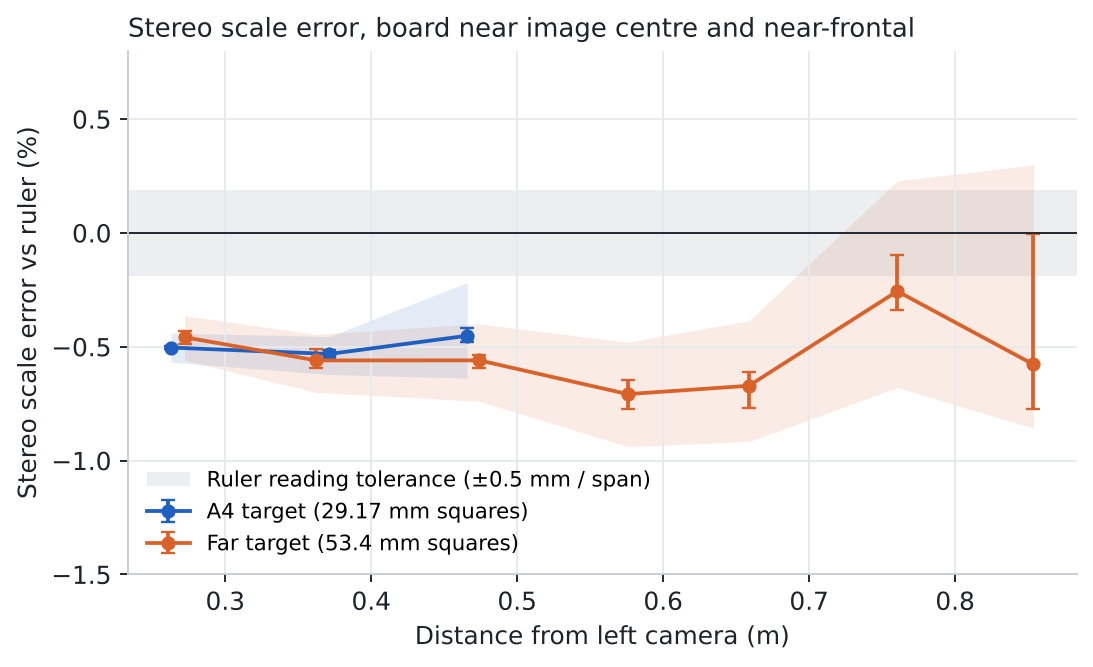
Across 2,492 centre, near-frontal frames from 0.25 to 0.85 m the median scale error was -0.51% (A4 target -0.50%, far target -0.54%). The two targets differ in size by a factor of 1.8 and still agree within 0.04 percentage points, which argues against a printing or measuring artefact of one board.
The bias does not grow with distance inside the tested range; only its spread grows (IQR widens beyond 0.7 m as each square shrinks to ~20 px). In millimetres the median bias corresponds to roughly 1.4 mm at 0.27 m, 2.5 mm at 0.5 m and 4.5 mm at 0.85 m, all on the short side.
| Target | Depth bin (m) | Median depth (m) | Frames | Median scale error (%) | 95% bootstrap CI of median (%) | IQR (%) |
|---|---|---|---|---|---|---|
| A4 | 0.2-0.3 | 0.27 | 684 | -0.50 | -0.51 to -0.50 | -0.57 to -0.44 |
| A4 | 0.3-0.4 | 0.38 | 259 | -0.53 | -0.55 to -0.52 | -0.62 to -0.46 |
| A4 | 0.4-0.5 | 0.47 | 316 | -0.45 | -0.48 to -0.42 | -0.64 to -0.22 |
| FAR | 0.2-0.3 | 0.27 | 176 | -0.46 | -0.49 to -0.43 | -0.56 to -0.36 |
| FAR | 0.3-0.4 | 0.36 | 160 | -0.56 | -0.59 to -0.51 | -0.70 to -0.45 |
| FAR | 0.4-0.5 | 0.47 | 414 | -0.56 | -0.59 to -0.54 | -0.74 to -0.40 |
| FAR | 0.5-0.6 | 0.57 | 140 | -0.71 | -0.77 to -0.64 | -0.94 to -0.48 |
| FAR | 0.6-0.7 | 0.65 | 137 | -0.67 | -0.77 to -0.61 | -0.92 to -0.39 |
| FAR | 0.7-0.8 | 0.75 | 169 | -0.26 | -0.34 to -0.10 | -0.68 to +0.23 |
| FAR | 0.8-0.9 | 0.85 | 35 | -0.58 | -0.77 to -0.00 | -0.86 to +0.30 |
Result 2
At the image edges: up to ~5% long on the left, near zero on the right
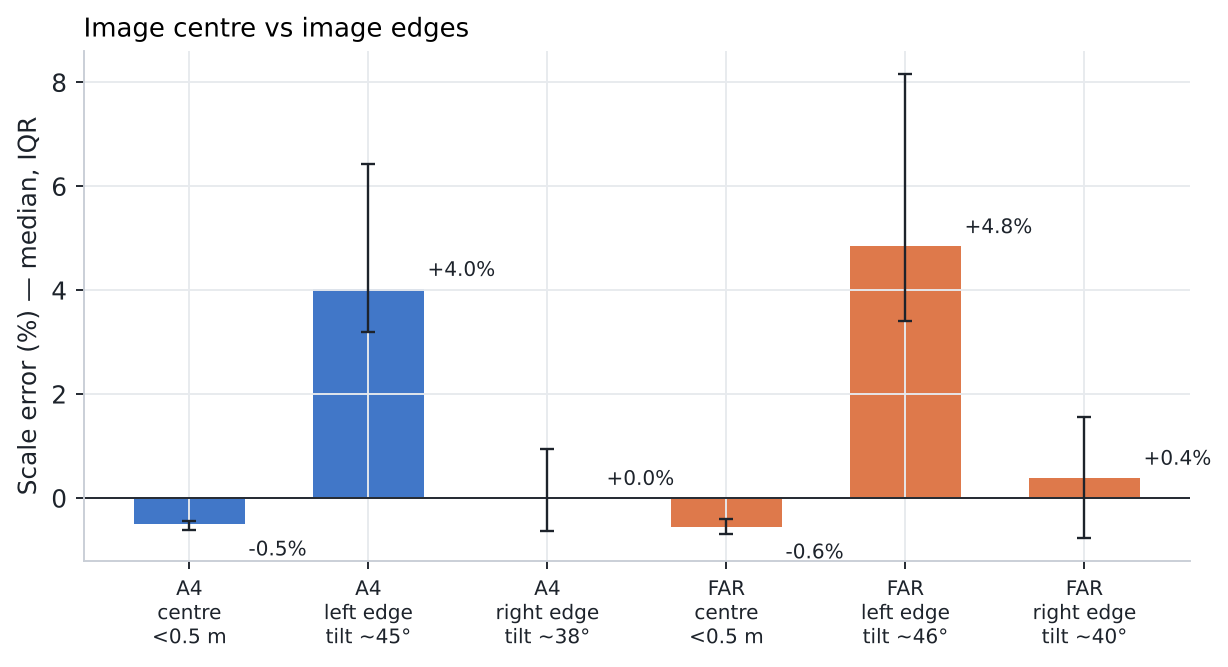
With the rig turned so the target sat near the left image edge (tilt ≈45°), squares came out +4.0% (A4) and +4.8% (far) too large, with a wide spread. At the right edge (tilt ≈40°) the median stayed at +0.0% and +0.4%.
We do not have an explanation yet. Field Note #11 shows elevated epipolar residuals at both the left and right periphery, so stereo misalignment alone does not explain why only the left edge is biased. Tilt and image position also change together in this data. Separating them needs a fixed-rig sweep with the target at several positions and tilts.
| Target | Image region | Frames | Median tilt | Median depth (m) | Median scale error (%) | IQR (%) |
|---|---|---|---|---|---|---|
| A4 | left edge | 378 | 45° | 0.28 | +4.0 | +3.2 to +6.4 |
| A4 | right edge | 326 | 38° | 0.26 | +0.0 | -0.6 to +0.9 |
| FAR | left edge | 462 | 46° | 0.35 | +4.8 | +3.4 to +8.2 |
| FAR | right edge | 408 | 40° | 0.32 | +0.4 | -0.8 to +1.6 |
Result 3
Tape-measure series: right slope, constant offset
Seven hand-held holds at 30–90 cm on the far target give a stereo-vs-tape slope of 0.980 with 0.7 cm RMS residual after removing a constant offset; the A4 target was detectable only at 30–50 cm and gives slope 1.029 (3 points).
Stereo distances are 2.3–5.6 cm shorter than the tape. The tape was zeroed at the wall, but the read-off point on the rig was not recorded and the tape ran diagonally and sagged at longer distances; both make the tape read long. The offset is therefore treated as a property of the tape setup, not of the stereo system, and is not used for the accuracy figure.
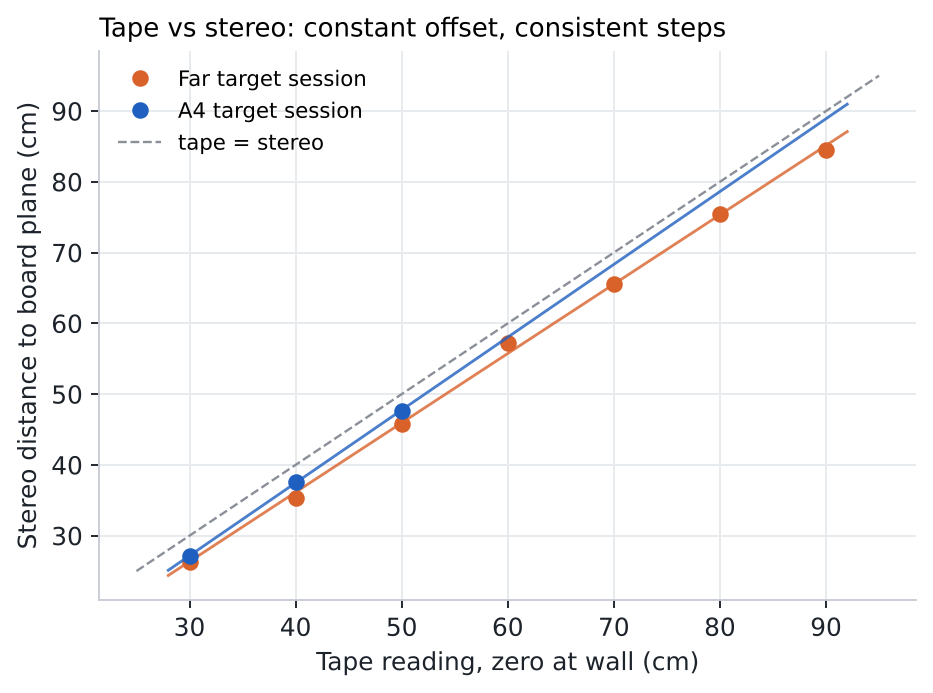
| Tape (cm) | Stereo, far target (cm) | Tape − stereo (cm) | Stereo, A4 target (cm) | Tape − stereo (cm) |
|---|---|---|---|---|
| 30 | 26.3 | 3.7 | 27.1 | 2.9 |
| 40 | 35.4 | 4.6 | 37.6 | 2.4 |
| 50 | 45.8 | 4.2 | 47.7 | 2.3 |
| 60 | 57.3 | 2.7 | not detectable | — |
| 70 | 65.6 | 4.4 | not detectable | — |
| 80 | 75.4 | 4.6 | not detectable | — |
| 90 | 84.5 | 5.5 | not detectable | — |
Interpretation
What a data user can take from this
Verified: with the factory calibration, metric scale near the image centre is about 0.5% short from 0.25 to 0.85 m on this unit. Estimated: a single global correction (multiplying depths by ≈1.005, equivalent to a baseline of ≈65.4 mm) would remove most of it; we have not yet validated that correction on independent data.
Interpretation: for hand-work data, the centre of the image is metrically reliable at the few-millimetre level, while the outer left part of the image is not. Users who need metric 3D near the periphery should weight or exclude those regions, or recalibrate with dense edge coverage.
- Use depth from the central field of view for metric quantities (object size, reach distance).
- Treat the left periphery (beyond ~450 px from centre) as uncertain at the several-percent level.
- Do not compare tape distances with stereo distances unless the tape read-off point on the rig is defined.
Limitations
- Single R8 stereo+IMU unit, single indoor office, single day (2026-10-26); results are not a population estimate for other units.
- All measurements are automated (OpenCV detection, triangulation, fitting). No independent human re-measurement was performed: AI/algorithm-only preliminary analysis.
- The factory calibration file is third-party material; it is used for evaluation but is not redistributed. Raw videos are not published (they contain people and a private office).
- Targets were printed on A4 paper and taped to a wall; flatness was not measured independently (triangulated planarity RMS 0.5–5 mm, growing with distance, is dominated by triangulation noise).
- Steel-rule reading tolerance of about ±0.5 mm per span corresponds to ±0.19–0.31% in square size; the reported −0.5% bias is about twice that tolerance.
- The rig was hand-held; tilt and image position co-vary in the edge sessions.
- The A4 target could not be detected beyond ~0.6 m; beyond 0.7 m only the 8-corner far target contributes, so those bins have wider uncertainty.
- The bottom part of the image (where hands often appear) was not covered by the edge sessions and is not evaluated here.
- AI-only preliminary analysis: no independent human sample verification has been performed.
Frequently asked questions
How accurate is the stereo depth of the ODL-EGO S1 rig at hand-work distance?
Near the image centre the measured scale error was -0.51% (median of 2,492 frames) between 0.25 and 0.85 m, about 2.5 mm short at 0.5 m. Near the left image edge with strong tilt it rose to about +4 to +5%.
What was used as ground truth?
The size of printed ChArUco squares measured with a steel rule across the full board span (29.17 mm and 53.4 mm squares). A tape-measure distance series was used only as a linearity check.
Why do tape distances disagree by 2–5 cm?
The tape was zeroed at the wall but its read-off point on the hand-held rig was not recorded, and the tape ran diagonally and sagged. The disagreement is a constant offset; the slopes were 0.98 (far target, 7 points) and 1.03 (A4 target, 3 points).
Was the calibration changed before measuring?
No. All depths use the manufacturer calibration supplied with the unit. A possible 0.5% scale correction is reported as an estimate only.
Was any of this checked by a person?
The ruler and tape readings were taken by a person; the detection, triangulation and statistics are automated. No independent human re-measurement of the results was done.
Does this apply to other R8 units?
Not automatically. It is one unit, one room and one day. The method and code are published so the same check can be run on each unit.
RESEARCH RESOURCES
Explore the Technical Resources
Access the code, datasets and evaluation materials.